This site uses cookies to improve your experience. To help us insure we adhere to various privacy regulations, please select your country/region of residence. If you do not select a country, we will assume you are from the United States. Select your Cookie Settings or view our Privacy Policy and Terms of Use.
Cookie Settings
Cookies and similar technologies are used on this website for proper function of the website, for tracking performance analytics and for marketing purposes. We and some of our third-party providers may use cookie data for various purposes. Please review the cookie settings below and choose your preference.
Used for the proper function of the website
Used for monitoring website traffic and interactions
Cookie Settings
Cookies and similar technologies are used on this website for proper function of the website, for tracking performance analytics and for marketing purposes. We and some of our third-party providers may use cookie data for various purposes. Please review the cookie settings below and choose your preference.
Strictly Necessary: Used for the proper function of the website
Performance/Analytics: Used for monitoring website traffic and interactions
With Q4 2023 wrapping up, it’s a pivotal moment for dealerships to reflect on the projected trends, their performance metrics, and how the market dynamics have evolved over the years. Q3 Reflection and Q4 Projections In Q3 2023, dealerships witnessed the actualization of several trends that were projected earlier in the year.
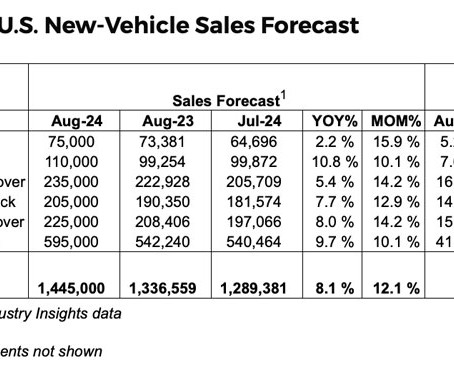
In August, the seasonally adjusted annual rate (SAAR), or sales pace, is expected to reach 15.4 The strong sales pace in July was partly fueled by a sales rebound following an industry-wide dealership software disruption that slowed the market in the second half of June. million, higher than last August’s 15.3
Last month, the sales pace had been forecast to finish much higher, but disruptions in dealership point-of-sale software programs at the end of June likely prevented some sales from being fully completed and reported. July 2024 has 25 selling days, the same as last year but one less than last month. July 2024 U.S.
We organize all of the trending information in your field so you don't have to. Join 5,000+ users and stay up to date on the latest articles your peers are reading.
You know about us, now we want to get to know you!
Let's personalize your content
Let's get even more personalized
We recognize your account from another site in our network, please click 'Send Email' below to continue with verifying your account and setting a password.


Let's personalize your content